X

467 | Back To The Future: Are Our 2015 Investing Strategies Still Relevant Today?


Folks, it’s time to strap your seatbelts in and tighten your property investing hats because in today’s episode, we’re doing our own Back to the Future with our first-ever Throwback Thursday!! 🔮

We’re revisiting our best property investing strategies and theories from aaallll the way back in 2015 and asking… 

Are they still relevant today?!?  

We’ll be unpacking (Yep, that’s still a favourite word of ours today 😉):  

🛠️ Ep 1. We Fix Bad Property Investment Advice: The two most common regrets we hear and our cornerstone “Barber Analogy”: Is it still applicable or has it become obsolete?!  

🚀 Ep 2. Regulation vs. Education: How has income vs. Property prices changed? And what makes inner land value 3x higher than land further out? 

🏠 Ep 3. The 4 Pillars of Mastery: Do we still use the same process to set investors up for success? And why is MoneySMARTS still extremely relevant today?!  

To hear all of this, plus some of our favourite quotes of all time from these episodes, tune into our first Throwback Thursday now!!  


Free Stuff Mentioned

  • We’ve got ONE last spot on our 2024 Summer Series. Share your story with us today! >>  
  • Check out Binge Guide featuring the first 20 episodes here >>  
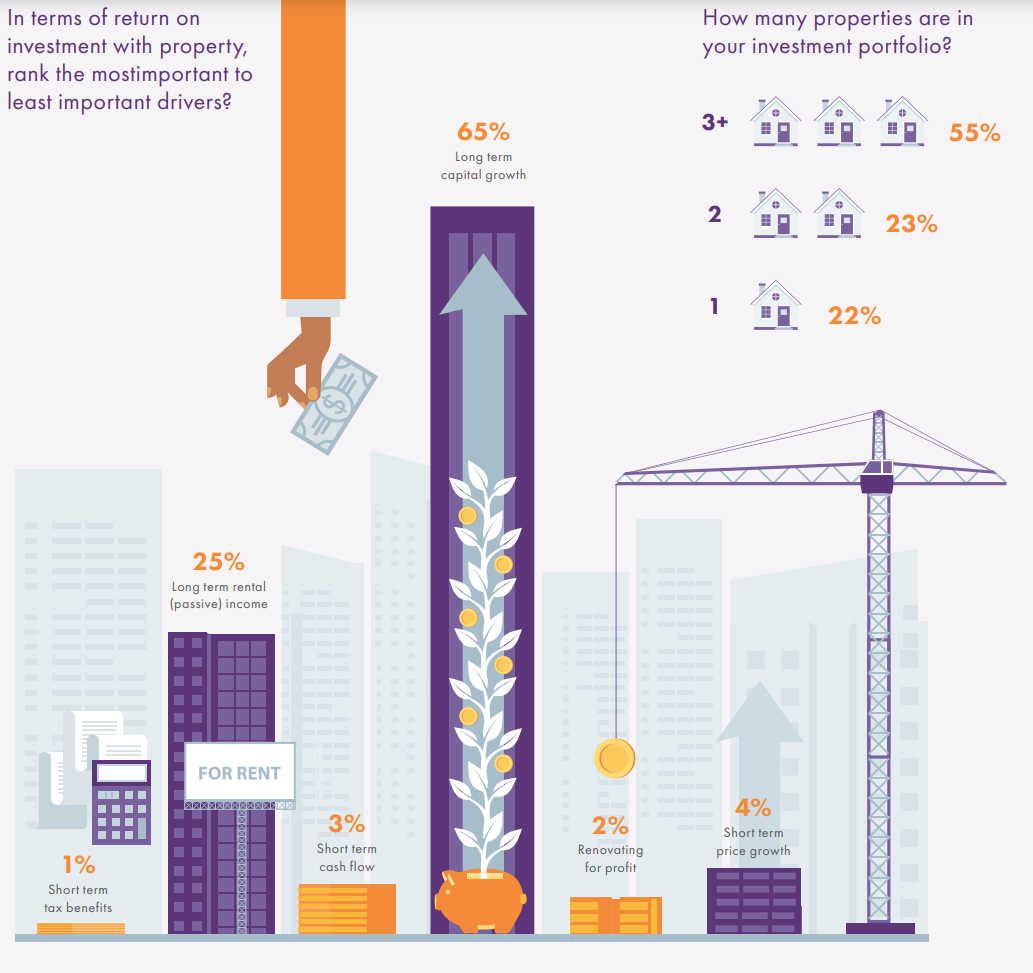
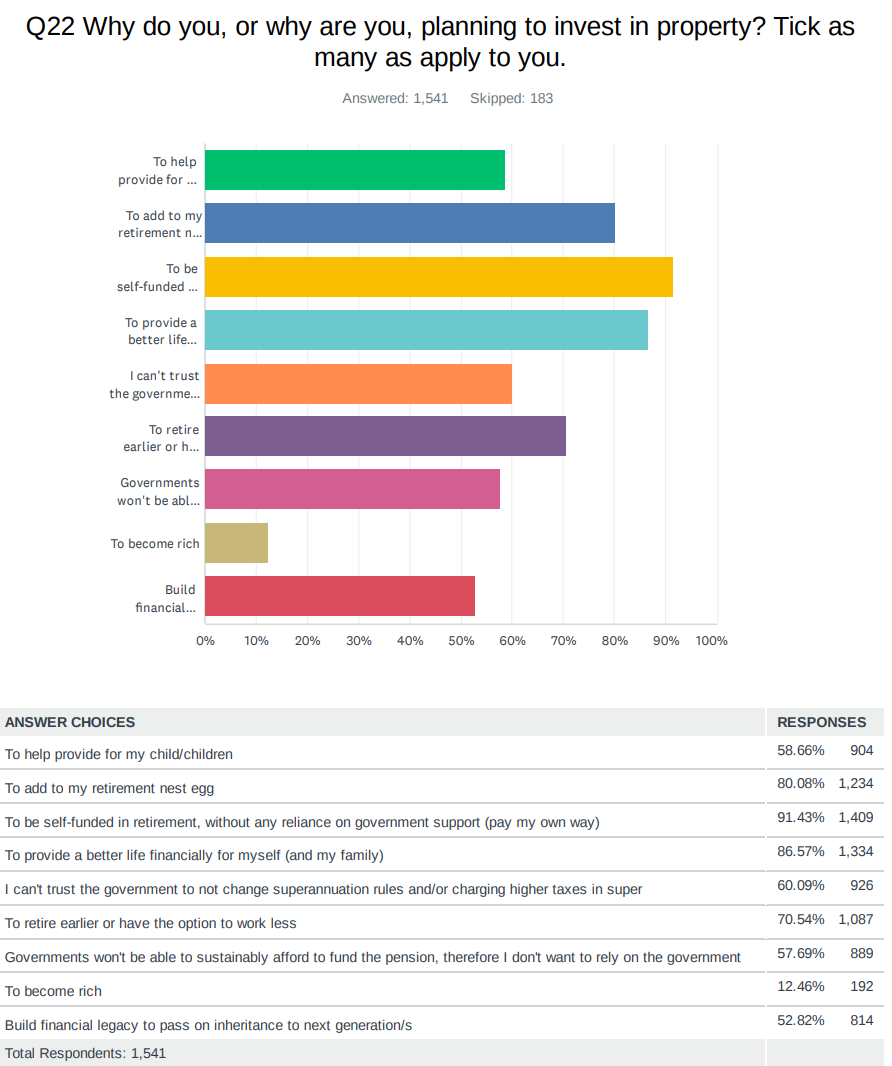
  • See the graphs from Ben’s What’s Making Property News! Below:  


Timestamps

  • 0:00 – Back To The Future: Are Our 2015 Investing Strategies Still Relevant Today?    
  • 2:15 – We’ve got one spot left on our Summer Series!  
  • 3:03 – Mindset Minute: Where the pursuit of Mastery lives…  
  • 7:26 – It’s Throwback Thursday!  
  • 8:55 – Ep 1. We Fix Bad Property Investment Advice  
  • 9:26 – 💈 The Barbershop Analogy 💈 
  • 15:29 – The 2 most common regrets 
  • 16:33 – Is it still relevant today?!?  
  • 19:12 – The Enthusiastic Amateur  
  • 22:40 – “You can get everything you want in life, if you just…”  
  • 26:14 – Ep 2. Regulation vs. Education  
  • 29:09 – These fundamental rules have not changed folks… 
  • 35:58 – The top #3 evergreen quotes 
  • 36:57 – Is buying counter cyclical still a good idea?  
  • 38:21 – What makes this land value three times higher than other land?  
  • 41:36 – Income vs. Property Prices: What’s changed?  
  • 45:55 – We always start with THIS when building our investing strategies… 
  • 47:51 Ep 3.The 4 Pillars of Mastery  
  • 48:56 – How we set up investors for success  
  • 52:12 – Debt Servicing Debt: Did this theory work?  
  • 54:19 – This is what drove MoneySMARTS… 
  • 58:47 – Our favourite quotes  
  • 59:42 – A moment for Ben 🤗 
  • 1:02:32 – Check out our free Binge Guide! >>  
  • 1:03:09 – Here’s to the Stig ❤️  

And… 

  • 1:04:32  Lifehack: Table tennis on the dinner table?!  
  • 1:07:27 – WMPN: Why People Invest in Property!  


Australian Housing Market Mid Year Update 2023

Hey there, we’re excited to share this mini property market update with you!

Back in February on Episode 429, we discussed our market outlook for 2023. Now, midway through the year, it’s time for a refresh!

So, let’s dive into the data and explore where the property market is heading and where potential opportunities lie.


Here are some of the data that Ben covered in this video (and yes, you can expect lots of graphs & screen shares 😉)

  • Starting with the macro data, we look at the Consumer Price Index, which shows past inflation trends. We’ve had highs in the past with soaring interest rates, but the good news is that inflation is trending lower now.
  • As we examine the cash rate history, we notice patterns related to inflation trends. The recent sharp increases are contextualised, and we find that we’re getting closer to a more normalised rate range of 3 to 4%, signaling the tightening cycle may soon end.
  • Now, let’s delve into the long-term perspective on property. Stay tuned as he shares his insights on where the property market is heading and the potential opportunities that may arise.
  • And heaps more!

Excited to share this valuable information with you. Let’s get started! 📊🏡


FREE RESOURCES:

Further Knowledge Building:

If you are considering or are in a position to invest in property, we’d highly recommend you continue to build your knowledge and understanding of the market by watching a Property Investment Masterclass that Bryce and Ben have made available. Combined, there are over 50 years of property investment experience. Our goal is to simplify the information down to key takeaways and proven processes that we know work to help you build a property portfolio that can help you retire on $2,000 a week.

Check out our Masterclass here >


Need professional help with your property journey?

If you’ve taken the time to watch our video and find yourself in need of professional assistance to kickstart or refine your property journey, we’d love to help!
Our award winning sister company, Empower Wealth is dedicated to providing tailored solutions to each of our clients’ unique circumstances.

Empower Wealth offers a complimentary and no-obligation initial consultation (more info here). This includes: Property Investment Advisors, Buyer’s Agents, Mortgage Brokers, Financial Planners and Tax Accountants.

Our process begins with this free consultation, during which we assess your current situation and discuss potential opportunities. There’s no obligation involved at this stage. If you’re already doing a great job working towards your goals, we’ll simply shake your hand and congratulate you. However, if we see potential in assisting you with your financial journey, we’ll let you know.

If you’re interested, simply fill in the form below to get in touch for a Free Initial Consultation or click here to learn more about Empower Wealth.

Name(Required)
This field is for validation purposes and should be left unchanged.


Raw Transcript:

Please note that this transcript is auto-generated and may contain a few typos and incorrect translations. For a smooth and insightful experience, we recommend watching the video while reading this.

Hello, Ben Kingsley here. I’m really pleased to be able to present this effectively, mini property market update in July. Earlier at the start of the year, in February, Bryce and myself on our very, very popular podcast, The Property Couch, I delivered a market outlook in terms of where we saw the market hitting over the course of 2023, and obviously I thought a midyear update would be important.

So I put together this little mini property outlook update for anyone who is interested in the property space. Now, back in February, we prosecuted the idea that the cash rate would only get to around 3.6% to 3.85%. Now we know at current time of recording the cash rate is currently sitting at 4.1%, so it’s important that we now look at where to from here if we think that interest rates still have a little bit of a way to go in terms of maybe one or two more rate rises.

I’m really pleased to be able to take a look at the data and share my narrative in my interpretation of that particular data. In terms of where I see the property market hitting and where I see some opportunities in that property market. So what are we waiting for? Let’s jump straight in to the story now. Of course, when you’re doing these sort of property updates, it’s very important to start with the macro data.

So we’re going to do a little bit of a look at most of the macro data that I’m talking about here. And so you can see here

I’m starting with the Consumer Price Index, which is the consumer price inflation story. And it’s really clear that when you study this and you start to get familiar with it, you can see that obviously during the eighties and obviously into the early nineties, we had very, very high inflation and that obviously caused very, very high interest rates for.

So I’ll get to in a moment. But the other thing we also saw here is we saw this stubborn story around inflation hanging around for longer. So you can see that in the quarterly seasonally adjusted numbers. And that’s that wage price spiral that I talk about when I do my economic and RBI updates each month. So we obviously want to try and avoid that.

And that’s what Governor Stevens and now our new governor who starts on the island in September, Michelle Bullock, is going to be focusing in on in terms of what that story looks like. Now, looking at today’s story here, we know how it started. It was obviously, you know, in terms of Russia invading Ukraine, etc.. And so we saw this big spark in terms of supply shocks and now it’s still hanging around in regards to obviously that localized demand or service led inflation that we’ve got coming through.

So the good news story is that it is trending lower, but we don’t want it hanging around for too long. We want to be able to get down to that lower inflation story. Now, I mentioned this earlier around what it sort of means for the cash rate. So it’s a blunt instrument instrument, I should say, that we’ve got in regards to how we measure that so we can see here’s the story of the cash rate coming down off those record high levels that our parents will talk about in terms of the interest rates they had to pay when they were growing up.

But when you start putting that story next to each other, you can start to see a little pattern emerging around that particular story. So I want to sort of come in here and show you what I mean by that. So you can see here is that sort of improving inflation story through the early nineties, and that’s that number coming down through here as well.

And the other thing I want to sort of focus in on and obviously as inflation has grown, we start to see this sort of story playing out as well in terms of this higher and sharper, you know, cash rate movement that we’ve currently seen. But when we start to put it into context, we can see that we’ve had interest rates or the cash rate around this area before.

And in fact, you know, this was sort of more our more normalized rate levels that we did enjoy once we really did improve productivity and we got rid of that inflation story and we didn’t have that wage price spiral experience that we had in the sort of late eighties, early nineties when we reset the economy and focus on productivity.

So this is obviously the story that we’ve got through here. But now we’re hopefully seeing more normalized rates sitting around net sort of 3 to 4% range. So we’re getting very, very, very, very close to that, that tightening cycle coming to an end. Now, this is probably a nice little time to segue way into the story around what happens over the long term when we talk about property.

So if you feel like you need to pause this video and study this in more detail, a quick explanation is really simple. We’re looking at around 43 years of data across all of our capital cities, and you can start to see, you know, that long term returns that we’ve enjoyed in the property market, even though we’ve had periods of higher inflation, we’ve had periods of higher cash rates and so forth.

So making that connection and understanding, you know, moving away from the recency bias, bias that we all feel when we’re actually making these types of decisions is really nicely spelled out when we compare and say that long term price trend across the market and across all capital cities. So, yes, property prices don’t always keep going up. But if you think about that longer term trend, you can see there that that has been the trend in regards to property prices across the country.

All right. So we’ve now talked about the inflation and the cash rate story. Let’s start to think about what’s happening with the consumer. And it’s very clear that when you start taking money away from the consumer and you start to slow the economy down, that sentiment is going to obviously adjust. And we can see that here. In terms of the optimism line, which is above 100, we have below that line and we’re sort of down in areas that we haven’t been down for a long time.

So a consumer sentiment is definitely challenged at the moment and it does feel like the economy will slow and we’re going to borderline, you know, sort of test the boundaries of a potential recession depending on how long interest rates have to remain higher for longer. So let’s move into the other important story here. And while we probably aren’t in that sort of more dire situation around sort of going into a recession at the moment is because of this unemployment story or more importantly, the actual high employment that we currently have across the nation.

So again, this is a mini update, so I’m not going to spend too much time on this. But just look at that unemployment rate line here where we’re saying, you know, the unemployment rate is in the threes, very, very solid in that particular area. So as someone who’s studying the macro story here and trying to make an interpretation around the property market, this obviously is a really good story because obviously means that there’s slightly less risk of seeing, you know, for sales or mortgage and position sales because we do have a fairly strong economy and we obviously have strong employment now.

So I’m looking then at forward indicators to give me a bit of a read on that. And you can see let me go down and take a look at the job vacancies and we can see in terms of these job vacancies that we’ve got this particular story playing out for us. So if you start to then take a look at those medium to longer term trends where we currently sit right now.

So we are definitely above that trend line in terms of what’s going on here. So we still have a fairly strong, robust job vacancy markets and that is also the reason why we’re still seeing those interest rate increases because, you know, we’ve heard from the governor and also the government of the day talking about the fact that, you know, through this mechanism of slowing the economy down, it is going to increase the unemployment rate and they are forecasting the unemployment rate will settle in the fours so that round that mid fall level.

So what we do need to see these job vacancy rate numbers coming down because obviously with more people arriving in the country, we’re still saying, you know, these job numbers are strong and those people who are arriving also getting gainful employment fairly quickly. The other big interesting part of, you know, the narrative that we’re hearing out in the marketplace and how that affects sentiment is this story around this fixed rate cliff.

So we’ve had these stories in the past which have amounted to nothing such as the interest only conversion in two principal and interest loans. Well, this is another one of these test cases that we’re going through right now. And we can really see that we’ve just passed the peak in terms of a significant number of fixed rate mortgages moving into variable mortgages.

And you can see, however, that we’ve still got this bulk of traffic that is coming through. Now, why is that materially important for context? Well, if you think about the typical average mortgage, 580,000, if you’re going from a really competitive two year fixed sorry, fixed rate of 2% and you’re moving to a 6.15 variable rate, as an example, we’re talking about 1350 dollars in additional repayments.

So that naturally gets a lot of click clickbait and a lot of news stories around that fear mongering about what’s going to happen. And so that’s why I’m trying to correlate that to the employment story to see whether these people are going to be able to maintain their property story in terms of being able to meet those repayments.

Now, as part of that story, we’ve also learned a lot about the household and how they’re consuming. So this is a really nice graph to sort of give you a sense of the consumption and the disposable income. So when we take away when we increase interest rates, we take away disposable income. And so we can see that consumption, that spending coming down.

But what we’re also seeing here, which is just as important, is that savings ratio is also falling considerably. And I do expect that to come down even further as we see more and more of these households having to pay higher mortgage repayments. But obviously we got to that level on the back of being stuck at home in lockdowns and not being able to have mobility and and also doing any of our spending that we would regularly do.

So that’s the story that we want to see, continue to keep tracking as we slow the economy down. And once we get to that peak, hopefully we’ll see interest rates pause and then ultimately I will see a downturn in terms at an interest rate. Now the next chart is a really important one. Also, when I start to think about how households are going to respond now I’m on record as saying do what ever you can.

If you are in a difficult position, do whatever you can to be able to trade through this period because it is only going to be a moment in time. So what am I looking for in terms of seeing people being able to do that? Well, with heaps of jobs available in terms of what’s happening out in the marketplace, you can see that a lot of people are taking on multiple jobs.

So you can see the dip, obviously that we saw through the first lockdown and the first wave of the pandemic and then that further dip. And these are consequences of lockdowns in places like Melbourne and Victoria and those type of things. But the trend is really meaningful in terms of people doing multiple jobs. So, you know, if you’re talking about the gig economy or doing some type of work like Uber driving or whatever, we’re going to see a lot more of that.

People taking those second jobs to be able to cover the mortgage as we go through this transition period to get inflation lower. So that is a good sign for me because I’m looking at the jobs are there. I’m seeing that the unemployment rate is still staying low and I’m seeing people do whatever they can to maintain those properties.

So we’re not necessarily going to see a glut of properties coming onto the market, but I’m highly attuned to that particular story when it comes to what’s going to be happening with property now on the on the supply and demand side or the demand side here. We also know this big story which is being made more political every day around this population story coming in.

A little fact that everyone needs to understand is any person coming through the country or numbers of population that are coming to the country are net positive when it comes to job creation. So if you hear any narrative from the Liberal Party or whatever saying, you know, it’s taking people’s jobs, blah, blah, blah, it’s not true. Okay, So ultimately you want to understand that.

But what we are seeing here is a significant number in excess of a million people over a couple of years that are going to be arriving to work and migrate into this country and settling to the great Australian dream. So that is going to obviously put upward pressure on supply because this is a demand led story in terms of that population growth.

So let’s let’s go a little bit deeper into that story and now looking look at those dwelling approvals so we can see here what’s really important for me to be studying and and what I am laboring on in my economic and RBA updates is this idea that we can say this is the decade average you can see in houses and units.

So through the homebuilder program and incentive we got a massive spike of homebuilding and that’s occurred. There’s obviously been some unintended consequences of that in terms of supply chain shortages, which has led to some of those builders collapsing. So it’s not a great story for some of those people who were getting their first home or or building their new dream home.

So you can see that coming down. You can see how volatile the unit market approval numbers are when you’ve got significant medium and high density approvals coming through. But there really is a construction lag that’s going on here that we’re also seeing play out in the numbers. So that says to me that supply is not going to arrive quickly, even though demand is continuing to improve.

Moving down on that, let’s take a closer look and start to think about where is this tracking so through our good friends at CoreLogic, we’ve got access to obviously these new listings at a national level. And so I’m I’m definitely following this little uptick that we’re seeing here with high interest. And Bryce and I will do a further update on the marketplace hopefully in August where we can get a sense of the listings coming for the for the spring selling season.

Because at the moment you can see it’s clearly below the long term five year average and it’s clearly below the activity we saw in 2022. So that in itself with these new listings is what’s keeping supply down and demand high and why property prices are continuing to grow at the moment. Now let’s look at total listings. So just remembering that this is new listings.

So we’ve seen a lift here, but what we also want to then look at as well, what does it mean for the overall supply? And we can still see that that has made a very limited dent in regards to our overall total listings of properties. And so when we’re talking about the potential risk in the marketplace in terms of, you know, mortgagee in possession sales or people for selling, we are definitely not seeing any of that.

And we’re also listening and reviewing the data being released by the big four banks in terms of their distressed or in arrears mortgage holders as well. And you know, we’ve seen some comments recently that there has been a slight uptick, but again, certainly below long term averages. So we’re not seeing any stress levels in the marketplace at the moment.

Let’s take a dive now and separate that in to the state and capital city markets. And so again, you feel like you need to pause this, to study this and a little bit more detail do so, but you can start to see those trends. Also remembering this is a year on year equivalent. So you might be wondering, well, Melbourne’s not as high as I expected it to be, but you’ve also got to remember that Melbourne’s had a very, very low supply of listings for several years now.

So that’s why that percentage number is a little bit lower than we would normally see compared to those other more active markets. Obviously Brisbane, Adelaide, Sydney had very, very strong performances during the COVID with record low interest rates, whereas Melbourne was continue to be shut down and obviously that impacted the confidence in the sentiment of the Melbourne market as well.

But that just gives you some idea in terms of new listings and total listings. So study that to get a more sense of the market. You know, again when we did our economic and I’m sorry, a property update and predictions for 2023, we did say that we thought that the worst was behind us in 2022 and we thought property prices would start to move because we didn’t expect interest rates to go above that 3.6 to 3.8.

And we did see that supply and demand imbalance starting to appear. And guess what? We were right. So February, March was obviously the period where we saw the bottom of most of those property markets. And we’re now starting to see price growth in a lot of those particular markets, with obviously exception to the Darwins and also the Hobart markets as well.

But that just gives you some idea. Now the question is obviously if interest rates and inflation remain stickier for longer, will we see a pause or a lull in the market? And I’ve got more to say about that in my closing statements. So again, let’s now break those quartiles down and start to study the market and in terms of what’s happening in different markets.

So it’s really clear that classically our two biggest centers, Sydney and Melbourne, are price recovery is always led by the 75% quartile market. They are less affected by these interest rate stories are generally speaking, higher incomes, not as as, you know, higher mortgages, but also higher incomes in those particular marketplaces. So it doesn’t affect those borrowers as much as the more vulnerable borrowers and those people who have got really high mortgages but low incomes.

So we’re seeing that in terms of where the price performance is coming from. Interestingly, Brisbane, Adelaide and even Perth for that matter, the price performance is coming from the bottom quartile of the market and I suspect that that is definitely a blend of those particular markets with first home buyers are competing with investors. We know through obviously our own business activities that those three markets are the hottest markets at those entry level price points and we expect that that’s obviously artificially putting pressure on that lower end of the market in terms of price performance and capital growth over that particular period.

Then you obviously go on say Hobart, Darwin and the ACT again, Hobart, Darwin and the ACT being led by that higher end of the market. So that’s obviously a good sign if things are stabilizing in those particular markets as well. Let’s move down now and have a look at the that the auction clearance right? So what I’m doing now is I’m going even granular and more time sensitive data.

What you’re looking at here is the three months and but what I’m getting down here is this is the week ending the 16th of July. So I’m recording that this week in terms of the performance. So what am I always looking for? I’m looking for leading indicators here. So I look at the auction clearance rates as part of those leading indicators and you can see the clear differential between clearance rates this year versus last year.

But you can also see the stock levels are lower this year to last year as well. So that’s feeding into higher demand, lower supply, and that’s putting pressure on prices on the upward side as well. So that’s exactly what we’re seeing here. I don’t read a lot into Brisbane, Adelaide, Perth markets given you can see the small volumes that are at play here.

But certainly our two leading capital city markets have a significant size of auction activity and that gives me a good indication in terms of where the market’s at, in terms of buyer sentiment and buy demand. Right. So what does that meant? Well, based on that data from this week, we’re seeing Sydney Point three up, Melbourne Point one for the week, Brisbane up 0.4, Adelaide point to Perth, Point to an and capital cities combined point to Sydney’s again having pretty strong price performance.

A 1.4%, Melbourne Point five. Brisbane 1.1. Adelaide point six, Perth Point six as well. So some pretty strong numbers. And so again, are we seeing, you know, a dip? Is this going to be a dead cat bounce or ultimately are prices going to continue to keep growing through that period? Now the best way to study that is I like to bring this chart up here and and again, I encourage you to pause so you can study this in more detail.

But the areas that I’m looking at as is this particular story here. So I’m looking at new listings compared to last year. So I can say there’s been a little spike in Sydney. We can also see in Melbourne terms that that that the supply of new listings is still in insufficient compared to last year. We can say Brisbane, Adelaide and so you can start to see those new listings and title changes.

They are still challenged markets. This is the commentary that I’ve been making around Hobart in regards to look at the oversupply of listings that they’ve got and that’s why it’s the most underperforming market in the country at the moment. And then obviously you can get a bit of a story around, you know, the ACT and Darwin and the combined capital.

So I look at that from a supply side and then sort of starting to see where that demand story fits into that particular thing. So in closing, again, it was a mini update. We’ll be doing a further update with Bryce on the podcast in August where we can get some more sensitivity around some of those trend lines that are occurring.

But in the short term, here are the headwinds, right? So there’s still potential for a couple more rate increases and that’s obviously affecting sentiment. And it’s also on the back of inflation remaining stickier. And so that for a lot of people is a means by which they are putting their they’re sitting on their hands and doing nothing. And that to me is an opportunity.

So I’ll explain that in a moment. We might see increase in supply. So there will be some people, if interest rates continue to go, we’re seeing the fixed rates that there’s definitely some investors who were overcommitted or not willing to change the law style elements that they’ve introduced into their household. So you will see a few of those investment properties are coming onto the market.

And there’s also no doubt that there will be some overstretched owner occupiers who have bought in that sort of low interest rate environment as part of that particular story as well. And so, you know, the way in which I look at that is I as I effectively say that that there’s going to be some risk in that side.

But I’m not seeing any material risk in the data. And I will continue to keep an eye on that and some sensitivity around that. Now, we we might also say in terms of the pace of those price increases, we might see that stalling. So we might see another lull coming into the market, which is really if I’m thinking about investors or or buyers who want to come into the market, it’s actually a good thing because what it’s giving you is, is the time you missed the bottom of the market.

It was February, right? So is it now going to be a situation where you’ve just got this extra window of time to be able to come into the market? Because there’s no doubt we’re going to see, you know, the employment story start to wane a little bit. But we still have this, you know, situation where supply is going to be materially and on the supply side for the market.

So what am I saying there? There’s some short term buying opportunities. You bet there are. Rental demand remains very strong. So we’re going to see improve rents. We’re going to see potential slightly higher interest rates, which effectively could reopen that buying window. So I call it the timing window before we potentially see this next rush. So, you know, we’ve been talking about there’s a lot of pent up demand out there.

We know that people are sitting on their hands and not doing anything about things. They’re waiting for that time. But the smart money says that, well, if there is going to be this rush, do you want to be competing against everyone else who comes into the market? So probably undersupply we are talking about years, not months in terms of that being resolved.

I continue to keep talking about market sentiment will improve. We see it in the short term data. So when we had that pause in May and the pause last month, you can immediately see activity. You know, we’ve got research platforms, so we see more activity on those research platforms. When people think this is, you know, the worst of it’s behind us.

Well, once there is more confidence around the tightening cycle being finished and done, we believe that that will start to move that sentiment story. And then finally, the sentiment story is going to obviously be charged up further with a significant amount of demand when the first cut in the cash rate to more normalized levels is going to kick in.

So the economists will respect that. Economists are talking about that rate cut happening around, you know, sort of my Bill Evans is my summer in March and in terms of where that happened. So I’m just calling it first half of next year where we will start to see potential easing of the cash rate. Now, even if we don’t see a easing of the cash rate in the cash rate lanes that, you know, sort of 4.6 or whatever it might land, that that’s still remembering quite comfortable.

You only need to go back to what we were looking at earlier in terms of those long term cash rates and exactly what happened to the long term performance of property. And that’s where I want to close it. I want to talk about the long term rewards. So what we are talking about there is the short term, but you know, those buying opportunities with this lull in the market could also be available to you.

But the long term rewards are going to be driven by the normalizing of interest rates. So they will come off this peak cycle. We’re obviously got strong population growth and lower inflation and obviously property is an awesome inflation hedge. And then obviously we have seen, you know, wage price growth and happening. Right. So wage growth, I should say, not wage prospect, but wage growth improving over time.

So that is obviously increasing borrowing power for that next uplift of of demand that we also expect to see. So so don’t lose sight of the long term story is always my long is my message and my final message which has been consistent from the day I’ve been advising people from effectively 2004 to this day is the best time to invest in property is when you can comfortably afford it.

In other words, you’ve done your cash flows, you feel like you’ve got good job security, you’ve got some buffers in there. That’s the best time to invest because the long term returns are going to be significant in terms of how they improve your overall financial position, whether you’re buying for owner occupier purposes or also whether you’re adding a couple of investment properties to also supplement your super in retirement.

It’s really important that you understand that message and you don’t get overwhelmed by the recency bias and also by the negativity that’s happening in the market. So if you see an opportunity there, I hope you take advantage of it. I’ve always said that again since we started the podcast that knowledge is empowering, but only if you act on it.

And that message also remains true. So I’ve got some value out of this particular presentation. I look forward to working with Bryce and giving you a further update as we look at more and more data over the coming weeks and sharing that that outlook for the second half of the year when we get on the property couch If you haven’t heard of the property cash before, it’s Australia’s number one Property Finance and Money Manager podcast.

You can find it all you good podcast players. And if you’re watching this on any of our YouTube channels, great. There’s obviously other educational content on there as well, so I hope you can check it out. We’ve got obviously the power wealth community. We’ve got the more community for money management and looking after your finances. And also we have the property couch, which is our educational platform that we get all of our messages out on.

So thanks again for watching. Hope you got some value. And again, remember, knowledge is empowering, but only if you act on it.


390 | Will Interest Rates CRASH the Property Market?!

With all the buzz around interest rate hikes and inflation, potential market crashes and unpayable mortgage debt, we’ve heard a couple of people feeling anxious about the future… 

We want you to stop. 

Take a step back.  

Breathe. 

And listen to this podcast cos’ we’re not only answering the Q: “Will Interest Rates crash the Property Market?!”, but we’re giving you 7 REASONS why we believe in our answer! (With cold hard numbers to back it up!)   

Can you guess them below!  

  1. S__ E_____   
  2. H____ supply  
  3. I________ 
  4. M_____ Stress Story  
  5. R____ undersupply  
  6. H____ B_____ (This one is often overlooked!)  
  7. H_______!  

 PLUS, we’re diving WAY deeper to cover: 

  • Is now actually a good time to invest in a property (You know, with that famous Warren Buffet quote to be “fearful when others are greedy, and greedy when others are fearful.”)  
  • Why you shouldn’t be investing if you have THIS personality… 
  • What principles should you have front of mind when consuming information about the market?? 
  • How can YOU be the voice of reason?  

Bryce also breaks down success into this ONE attainable thing…Tune in to find out what it is now!!  

P.S. If you haven’t heard…. we’ve got a SPECIAL BONUSISODE for you this week which is all about maximising your tax returns as we bring in the new tax season –  listen in now! 


Free Stuff Mentioned… 


Here’s some of the gold we cover… 

  • 1:34 – Listen to this part for a WHOLE HEAP of special Bonuses! (An email full of FREE RESOURCES?! You’ll want to hear this…)  
  • 8:53 – All success requires is s_____!  
  • 14:28 – This should be the foundation of your thinking… 
  • 18:16 – How YOU can be the voice of reason! 
  • 25:40 – Got Buyers’ Remorse? Ask yourselves these questions.  
  • 28:30 – OUR ANSWER! (Are we just Prosperity Preachers?!) 
  • 30:28 – Reason #1: S_____ E______  
  • 34:28 – Reason #2: H____ Supply  
  • 38:11 – Lets Data Dive into Reason #2!  
  • 39:18 – Reason #3: I______! aka. We NEED people!  
  • 41:25 – Reason #4: M_____ Stress Story  
  • 44:08 – Another Data Dive! (How bad is the debt?!)  
  • 52:20 – Reason #5: R____ undersupply  
  • 53:45 – Reason #6: H____ B_____ (This is a cultural one! Think “The Castle” folks…) 
  • 57:47 – Reason #7: H_______! 
  • 1:04:54 – Is now the best time to buy?! 
  • 1:07:10 – Don’t invest now if you have THIS type of personality!  
  • 1:12:50 – Give us your Interest Rate Questions!! (Click the tab on the bottom right side of the page)  

And  

  • 1:14:12 – Why Ben HARDLY types anymore (aka. Bryce’s Lifehack for today 😉 
  • 1:16:03 – A breakdown of CoreLogic’s Pain and Gain report. 


380 | Is the Property Market Past its Peak?

With Australia’s housing boom slowing and interest rates on the horizon, folks it’s finally time to ask… 

Is the property market past its peak?! 

To help us answer this question we’re doing a deep data dive into CoreLogic’s Hedonic Home Value Index February report!

We’ll be unpacking the cycle just passed, its monthly and annual data, and what it means for our future…


But remember folks: We’re talking about the peak rate of growth!

While this means we probably won’t see the same level of growth in 2021, it does NOT mean you shouldn’t invest for the rest of the year!!

We’re also making some projections into 2022’s capital growth, breaking it down to the positives and negatives we expect to see in demand and supply.

You can expect us to cover everything from population movement to immigration, commuting to climate change and more!! 


But before you go check out the podcast, we’ve got a special announcement…

IT’s OUR 7th BIRTHDAY!

(Well, it was last week but time flies when you’re having fun 😉). A huge thank you to the Stig, our team, and all our listeners and contributors who make us what we are! 

But back to the good stuff… this episode has loads of future predictions that could help you make the best decisions in 2022, so tune in now!


Free Stuff Mentioned


Here’s what we cover…

  • 2:28 – It’s our birthday! (Well belated 😉) A big THANK YOU to all our listeners!
  • 4:40 – Oldrentvestor aka. Jane, contact us for a free “Start & Build” course! You’ve warmed our hearts.
  • 7:10 – Break the Cycle. Be the Change.
  • 9:30 – What we saw over the past cycle (and what caused it!)
  • 12:00 – 2 important indicators that investors should research
  • 14:14 – Data diving into the numbers!
  • 15:54 – Median house values have tipped over THIS mark in Sydney, Melbourne and Brisbane
  • 17:05 – We’re seeing the ___ of the cycle! (In terms of RATE OF GROWTH)
  • 18:15 – The Australian property market through the pandemic till now.
  • 21:00 – What do we mean by markets within markets?
  • 23:38 – Why Perth is in for an interesting ride…
  • 24:50 – The ____ quartile has seen the greatest growth (And what this means!)
  • 26:40 – What is Hobart’s income story?
  • 28:00 – Just remember THIS when people are talking about debt!
  • 28:55 – Looking forward to 2022 (In terms of future capital growth!)
  • 29:46 – Demand negatives: The who, what, why and when of Population Movement
  • 32:28 – The Affordability Story
  • 35:00 – How Queensland’s floods are impacting property markets
  • 36:40 – Demand positives: Immigration and home ownership
  • 37:40 – The Government’s forecast for incoming travellers!
  • 41:17 – As property prices slow, ____ will go higher
  • 42:20 – Supply Positives: Cost to build, normalisation of markets and more!
  • 44:55 – Why is Nimbyism good for capital growth?
  • 46:35 – Supply Negatives: Commutable markets
  • 51:00 – Remember it’s the long-term game folks!
  • 51:33 – Our 2022 predictions
  • 54:05 – Have you thought to use THIS as a portable phone stand?


302 | Back To The Future: Lessons From 50 Years At The Top Of His Game – Chat with Scott Keck

Want to hear from an Expert Witness who has been observing and analysing the property market for over FIFTY years? And what if they also happen to be a highly regarded industry professional who’s literally been valuing the price of property for more than five decades…?

… you’d probably get a bucket load of invaluable intel, right?

Well, let’s put it this way… the gold from today’s guest is well worth a king’s ransom! One of our favourite episodes yet – and you’re about to hear from someone who’s property knowledge is off the charts and who, let’s face it, we’ve been admiring from afar for years!

Welcome to the couch… Scott Keck!

Scott Keck is Chairman of Charter Keck Cramer, a leading Australian independent, strategic property consulting firm. Scott has more than 50 years property valuation experience within the Melbourne market, having begun with the firm in 1968, becoming a Director in 1978, Managing Director in 1984 and Chairman in 2010. He is considered one of the best and most high-profile valuer.

He is frequently engaged as a senior negotiator in complex commercial and statutory issues related to the property market and for advice in relation to large portfolio valuations for major statutory and private corporations.

And get this… in the last eight years alone he published over 500 articles on the property market!!

So, what can we ALL learn from someone who’s been in the market before we were even born???


Free Stuff


Here’s What We Cover…

(FYI: so much! This is practically a property masterclass 🙌)

  • So… what does someone who has over fifty years’ experience have to say about the property market??
  • Scott’s views on property as an investment
  • What’s changed over the decades? (Design styles, construction materials, floorplans, the use of space etc, the urban sprawl, density etc, etc)
  • What does this tell us about buyer demand?
  • Very Important Observations About Humans and Property Over 50+ Years!
  • What (if anything) has been consistent with the property market?
  • What’s the most interesting property Scott has ever had to value?
  • Post COVID-19, what does the residential property market look like?
  • What would prevent/impact this from happening?
  • Is it likely that people will want to continue living in capital cities moving forward?
  • Why will the “four pronged strategy” to get the economy moving again influence the price of property?
  • How on earth will population DOUBLE over the next 40-50 years?
  • And what will the property market look like to cater for this demand?
  • For investment purposes, how many bedrooms should a townhouse have?
  • Why do Off The Plan’s almost always outperform?
  • A deep dive into Off The Plan numbers: Why you’re in trouble before the house is even built!
  • What will the future of Melbourne look like? And will this now change with COVID-19?


“For every two people that come we need a new dwelling” – Scott Keck


Instagram

Free Resources

What to be notified when there are
new updates & free resources?

  • This field is for validation purposes and should be left unchanged.

×

MONEY SMARTS SYSTEM

Plus We Will Also Notify You When We Release New Episodes

We Only Send You Awesome Stuff

×

SUGGEST A GUEST!

We Only Send You Awesome Stuff

×