Who This is For
This is for anyone who wants to make more informed property decisions, including:
- Property investors researching their next purchase
- Home buyers comparing locations
- Existing investors reviewing their portfolio
- Anyone who’s been told “it’s a good location” and wondered what that actually means
You don’t need to be a property expert. The framework is designed to help you see the bigger picture more clearly.
Why Download This Infographic?
Population growth. A new train station. Close to the city. Tight supply.
These are the things people usually point to when they call somewhere a “good location”. They all matter, but none of them tells the whole story on its own.
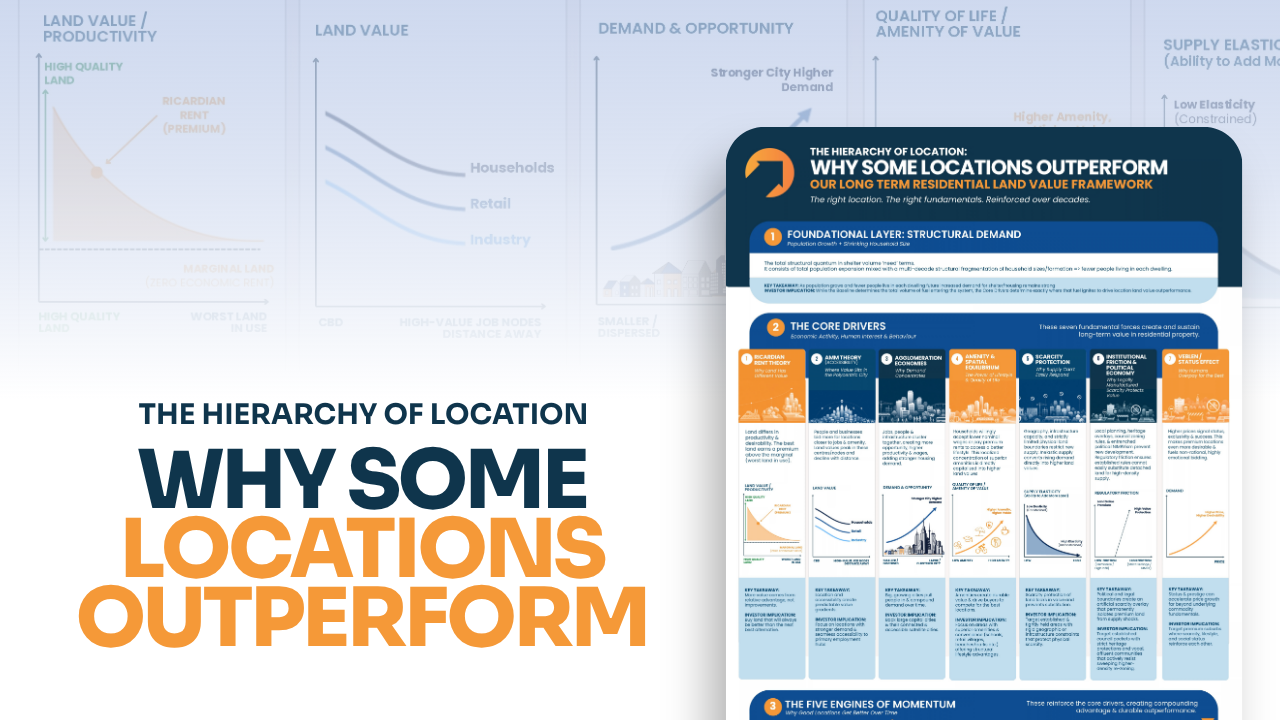
This infographic shows how the different forces shaping a property market fit together, so you can separate long-term fundamentals from short-term noise. It’s something to keep beside you while you research… and to come back to whenever a suburb starts getting talked up.
What You’ll Learn
 Why population growth and shrinking household sizes can support underlying housing demand
What separates a location with lasting appeal from one that’s simply having a moment
How good locations can build momentum and become more desirable over time
Why interest rates, credit and government policy can affect the timing and strength of market cycles
How to ask sharper questions when you’re comparing suburbs
What’s Inside?
This one-page infographic breaks location analysis into four digestible layers:
1. The Foundations. Structural demand driven by population growth and shrinking household sizes.
2. The Seven Core Drivers. From accessibility and amenity to scarcity and status: the forces that shape where long-term value concentrates.
3. The Five Engines of Momentum. Talent, demographics, amenity upgrades, capital and reputation, and how they reinforce each other.
4. The Seven Cycle Amplifiers. Interest rates, credit, tax and policy, sentiment and more: the factors that can drive short-term market ups and downs.
Look Beyond the Headlines
Keep this handy the next time you’re researching a suburb, comparing markets or assessing a property opportunity. Enter your details above and we’ll send the infographic straight to your inbox.